تفاصيل الخبر
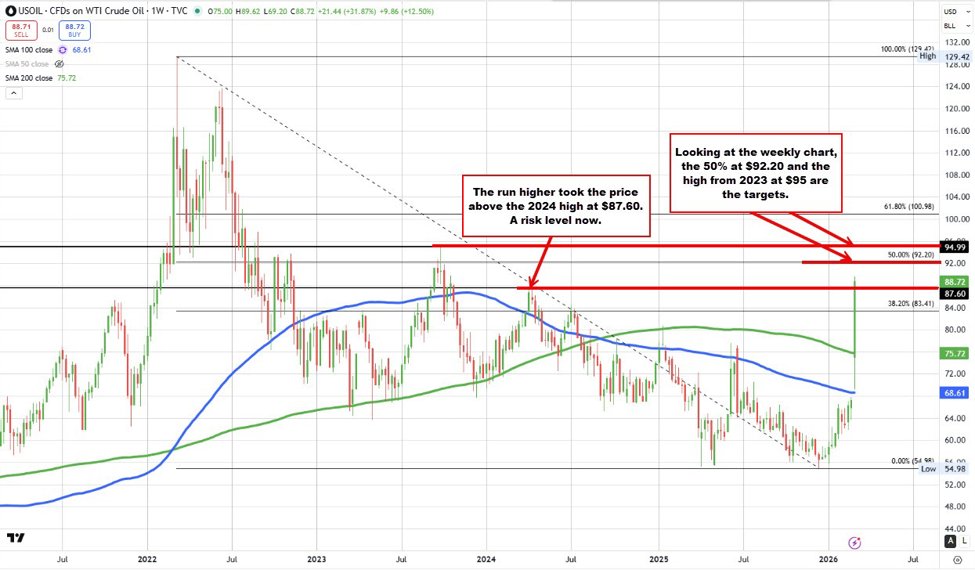
ارتفعت أسعار النفط الخام أكثر من 9% في جلسة تداول واحدة لتصل إلى 88.74 دولارًا للبرميل حسب أحدث البيانات. هذا يأتي بعد زيادة أسبوعية بلغت 32%، وهي أكبر زيادة أسبوعية منذ عام 2020. السعر تجاوز قمة أبريل 2024 البالغة 87.60 دولارًا وهو الآن يتجه نحو مستوى 90 دولارًا النفسي. تحليل تقني يبرز مستويات المقاومة الرئيسية عند 92.20 دولارًا (50% من تصحيح فيبوناتشي) و95 دولارًا (قمة 2023). يراقب التجار بانتباه مستوى 89.70 دولارًا، حيث أن الاختراق الفاشل فوق هذا المستوى قد يؤدي إلى تصحيح هبوطي إذا تراجع السعر تحت خط الاتجاه الصاعد الأدنى. يرتبط الصعود الحاد بمخاوف جديدة بشأن العرض وتوترات جيوسياسية، مما يزيد التقلبات في أسواق الطاقة. بالنسبة للمستثمرين، فإن مستوى 90 دولارًا يمثل حاجزًا نفسيًا مهمًا، حيث قد يؤدي اختراقه إلى جذب مراكز شرائية جديدة. ومع ذلك، يشير الفشل في الحفاظ على الزخم فوق 89.70 دولارًا إلى ضغوط بيعية قائمة. السوق ما زال في نطاق ضيق بين 54.98 دولارًا (القاع في 2025) و88.74 دولارًا، مع عمل مستويات تصحيح فيبوناتشي كمؤشرات تقنية رئيسية. لأسواق العالمية، قد يؤدي ارتفاع مستدام فوق 90 دولارًا إلى إحياء الضغوط التضخمية وتأثيرها على قطاعات الأسهم مثل الطاقة والسلع. يجب على المستثمرين في الخليج مراقبة مستويات 92.20 و95 دولارًا، حيث أن الاختراق قد يشير إلى تغيير في الاتجاه على المدى المتوسط. في المقابل، انخفاض تحت 87.29 دولارًا سيؤكد السيناريو الهبوطي، مما قد يؤدي إلى تراجعات جديدة نحو منطقة الدعم عند 55 دولارًا.
Crude oil prices surged over 9% in a single trading day, reaching $88.74 per barrel as of the latest data. This follows a 32% weekly gain, marking the largest weekly increase since 2020. The price has surpassed the April 2024 high of $87.60 and is now approaching the $90 psychological level. Technical analysis highlights key resistance levels at $92.20 (50% Fibonacci retracement) and $95 (2023 high). Traders are closely monitoring the $89.70 area, where a failed breakout could trigger a bearish correction if the price falls below the rising lower trendline.
The sharp rally reflects renewed supply concerns and geopolitical tensions, which are amplifying volatility in energy markets. For traders, the $90 level represents a critical psychological barrier, with a break above it likely to attract more bullish positioning. However, the failed attempt to sustain momentum above $89.70 suggests lingering bearish pressure. The market remains in a tight range between $54.98 (2025 low) and $88.74, with Fibonacci retracement levels acting as key technical indicators.
For global markets, a sustained move above $90 could reignite inflationary pressures and impact equity sectors like energy and commodities. Gulf investors should monitor the $92.20 and $95 levels, as a breakout could signal a shift in the medium-term trend. Conversely, a breakdown below $87.29 would validate a bearish scenario, potentially leading to renewed declines toward the $55 support zone.
The price of crude oil has continued its sharp move to the upside. The current price is trading at $88.74. For the trading day versus the settle price from yesterday at $81.01:Price change: $88.74 − $81.01 = +$7.73Percent gain: (7.73 ÷ 81.01) × 100 = +9.54%The high price extended to $89.62 just short of the $90 level. For the trading week, the price is currently up 32% that's the largest increase going back to 2020. The price today extended above the high price from April 2024 which reached $87.60. The low for the year was reached on January 7 at $55.76. Trump started his 2nd term in January 2025 when the price was at $76.24. The low price for 2025 reached down to $54.98 in 2025 there were 5 separate lows reached between $54.98 and $55.96.Looking at the weekly chart, the next major target would be the 50% midpoint of the move down from the 2022 my price. That level comes in at $92.20.Above that, and traders will look toward the 2023 high price near $95.If sellers are looking for hope, it comes from the rejection above the topside channel trendline on the shorter-term 5-minute chart (see chart below). The latest spike higher pushed the price briefly above that channel resistance near $89.70, which also coincided with a recent swing high. However, the move could not sustain momentum above that level and quickly rotated back lower.As long as the price remains below the $89.70 area, that failed breakout keeps the door open for sellers. The next step for the bearish case would be a move below the lower channel trendline, followed by a break of the 38.2%–50% retracement zone of the most recent leg higher between $87.29 and $87.84. A move through that area would signal that sellers are gaining traction and could shift the short-term bias more clearly to the downside. However, the price would need to stay below the rising lower trendline. This article was written by Greg Michalowski at investinglive.com.