Article details
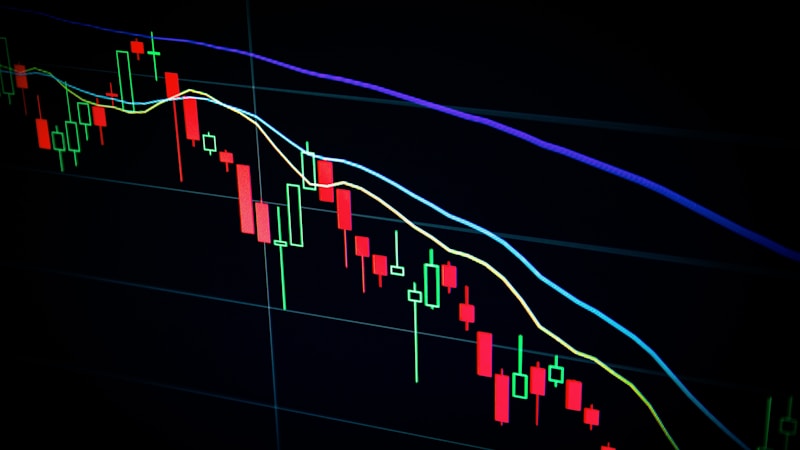
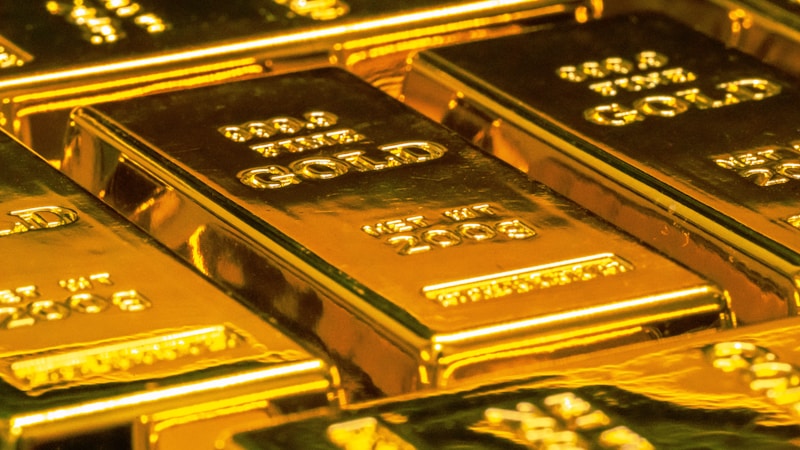
تراجعت أسعار الذهب إلى أدنى مستوى لها في شهرين عند 4289.87 دولار للأونصة في 8 يونيو 2026، مسجلة انخفاضًا تحت المتوسط المتحرك 200 يوم لأول مرة منذ أكتوبر 2023. جاء هذا التراجع بعد تقرير الوظائف الأمريكي القوي الذي أعاد تنشيط توقعات رفع أسعار الفائدة من قبل الاحتياطي الفيدرالي. فقد الذهب أكثر من 23% من ذروته التاريخية البالغة 5595 دولارًا التي سجلها في 29 يناير، مع هبوط حاد بنسبة 3% في جلسة الجمعة. ويربط المحللون الانخفاض بارتفاع عوائد السندات الأمريكية، والتوترات الجيوسياسية في الشرق الأوسط التي دفعت أسعار النفط، وزيادة مخاطر التضخم. ارتفعت عائدات السندات الأمريكية لأجل 10 سنوات فوق 4.50%، بينما تجاوزت عائدات ألمانيا 3.00%، مما يزيد تكلفة الفرصة البديلة لاحتواء الذهب الذي لا يدر ربحًا. هذا التحول في السوق له تأثيرات كبيرة على المتداولين. تضغط أسعار الفائدة المرتفعة عادةً على الذهب، مما يجعل الأصول التي تدر دخلًا أكثر جاذبية. من المتوقع أن تشدد المصرف المركزي الياباني والمصرف الأوروبي سياساتهم النقدية، مما يزيد الضغط على الذهب. بالنسبة للمتداولين، يتحول التركيز الآن إلى بيانات التضخم الأمريكية وخطابات الاحتياطي الفيدرالي وتحركات أسعار النفط. تشير Technical Indicators إلى مخاطر هبوط إضافية، مع تحول مستوى 4360 دولارًا من دعم إلى مقاومة. كسر هذا المستوى قد يشير إلى تصحيح أعمق نحو 3430 دولارًا. يجب على المستثمرين في منطقة الشرق الأوسط وشمال إفريقيا مراقبة كيفية تأثير العوامل الاقتصادية العالمية، مثل قرارات الفائدة الأمريكية والتوترات في الشرق الأوسط، على تقلبات الذهب. يُظهر التحول الأخير من التفاؤل إلى التشاؤم أهمية استراتيجيات التحوط وتحديث سياسات البنوك المركزية. المخاطر الرئيسية تشمل استمرار مخاوف التضخم وارتفاع أسعار الطاقة، مما قد يؤخر خفض الفائدة ويحافظ على العوائد المرتفعة. يُنصح المتداولون بمراقبة المتوسط المتحرك 200 يوم كمستوى حاسم لاحتمالات التراجع.