Article details
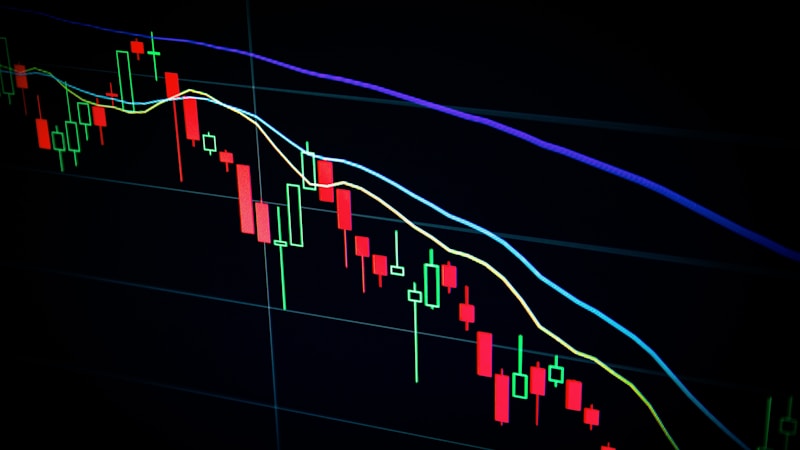
تراجعت مؤشرات الأسهم الأمريكية، حيث تراجع ناسداك 100 بأكثر من 6% عن ذروته الأخيرة، مع تسجيله خسارة يومية قدرها 4.74% في 6 يونيو 2026، وهي أسوأ أداء له في هذا العام. تشير Technical Analysis إلى أن الهبوط قد يستمر إذا اخترقت المستويات الداعمة المهمة، مما يثير مخاوف من تصحيح أعمق. كما أظهر مؤشر & 500 ضعفًا مماثلاً، رغم غياب التفاصيل الكاملة في المصدر. تُعزى هذه التقلبات إلى عدم اليقين الأوسع في السوق بسبب إشارات اقتصادية مختلطة ومخاطر قطاعية في الأسهم التكنولوجية. للمستثمرين، تُظهر الهوة الحادة في ناسداك 100 أهمية مراقبة Technical Indicators مثل مستويات الدعم والمقاومة وحجم التداول. قد يؤدي اختراق مستويات حرجة إلى تحفيز بيع إضافي، بينما قد يختبر ارتداد السوق صلابة المشترين. تصبح إدارة المراكز وتحديد نقاط وقف الخسارة أمرًا حيويًا في ظل هذه الظروف المتقلبة. يجب على المستثمرين في الخليج مراقبة ضعف المؤشرات المرتبطة بالأسهم التكنولوجية والتأثير المحتمل على القطاعات الأخرى. سيؤثر إشارات السياسة النقدية من البنوك المركزية وبيانات الاقتصاد الكلي القادمة على التوقعات القصيرة المدى. قد يفكر التجار في استراتيجيات تحوط أو عمليات خيارات قصيرة المدى إذا تعمق التصحيح.